Heaptrack
Heap memory profiler for Linux
Heaptrack traces all memory allocations and annotates these events with stack traces. Dedicated analysis tools thenallow you to interpret the heap memory profile to:
- find hotspots that need to be optimized to reduce the memory footprint of your application
- find memory leaks, i.e. locations that allocate memory which is never deallocated
- find allocation hotspots, i.e. code locations that trigger a lot of memory allocation calls
- find temporary allocations, which are allocations that are directly followed by their deallocation
Heap memory usage profiler. It uses LD_PRELOAD to track all calls to the core memory allocation functions and logs these occurrences. Additionally, backtraces are obtained and logged. It can also generate a historigram of allocation sizes over the number of calls. Heaptrack measures the following: . * Heap memory consumption (like Massif). * Number of calls to allocation functions (like callgrind). * Total amount of memory allocated, ignoring deallocations. * Leaked memory (like memcheck). . Heaptrack is notable for its ability to attach to running processes, for consuming substantially less memory than Valgrind, and for not reducing an application's interactivity as much as Valgrind does. Heaptrack is useful for debugging memory leaks and memory ballooning. . The package contains the GUI for data analysis.
How to install Heaptrack in Ubuntu
If you are on a supported distro like Ubuntu, Linux Mint, elementary OS etc. you can install the application through software center by clicking the below link.
If the above link not working, run the below command in terminal to install heaptrack-gui in Ubuntu
sudo apt install heaptrack-gui
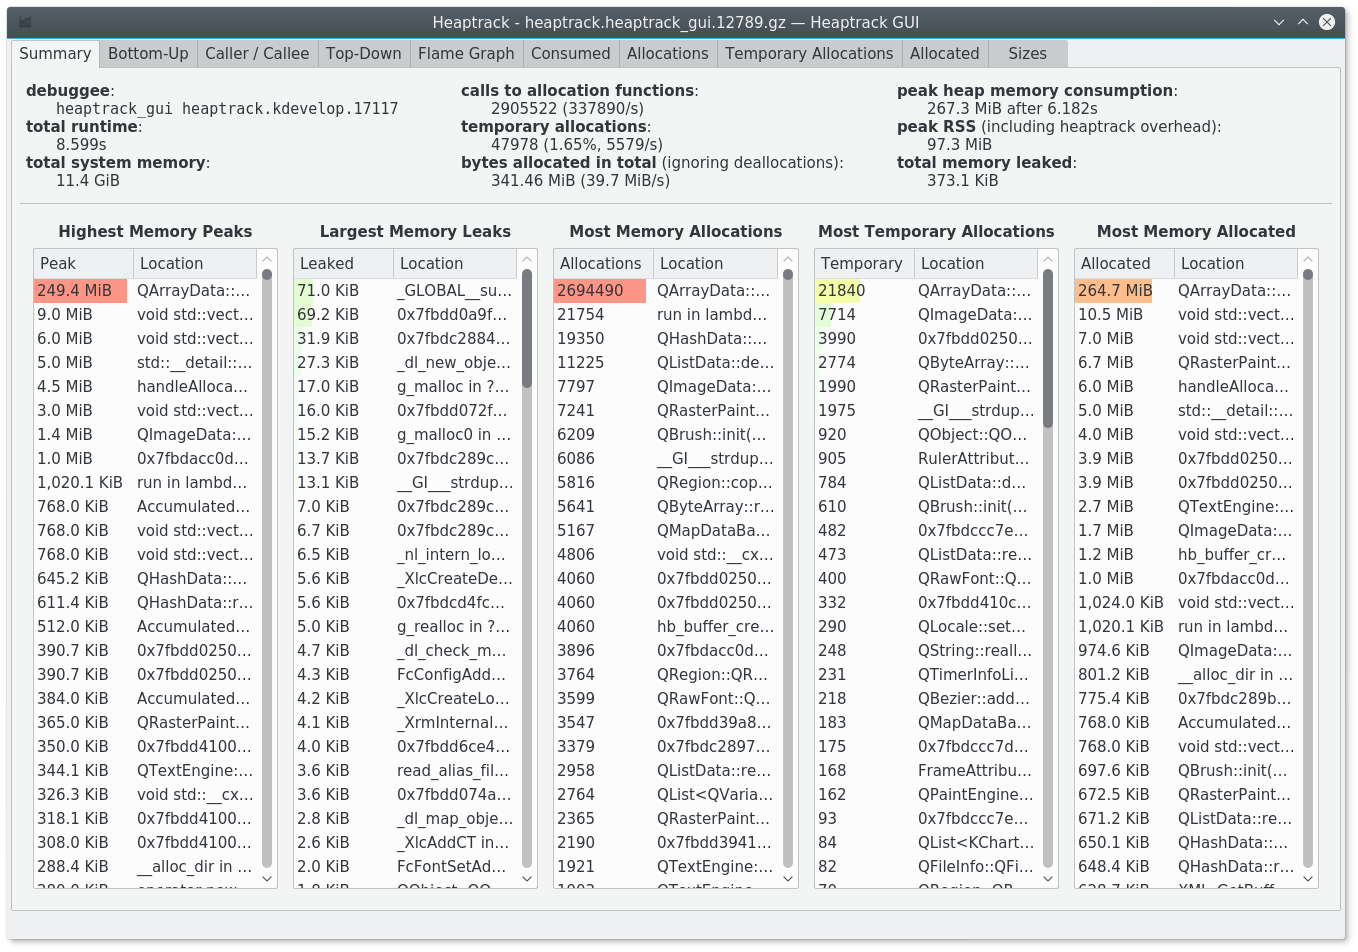
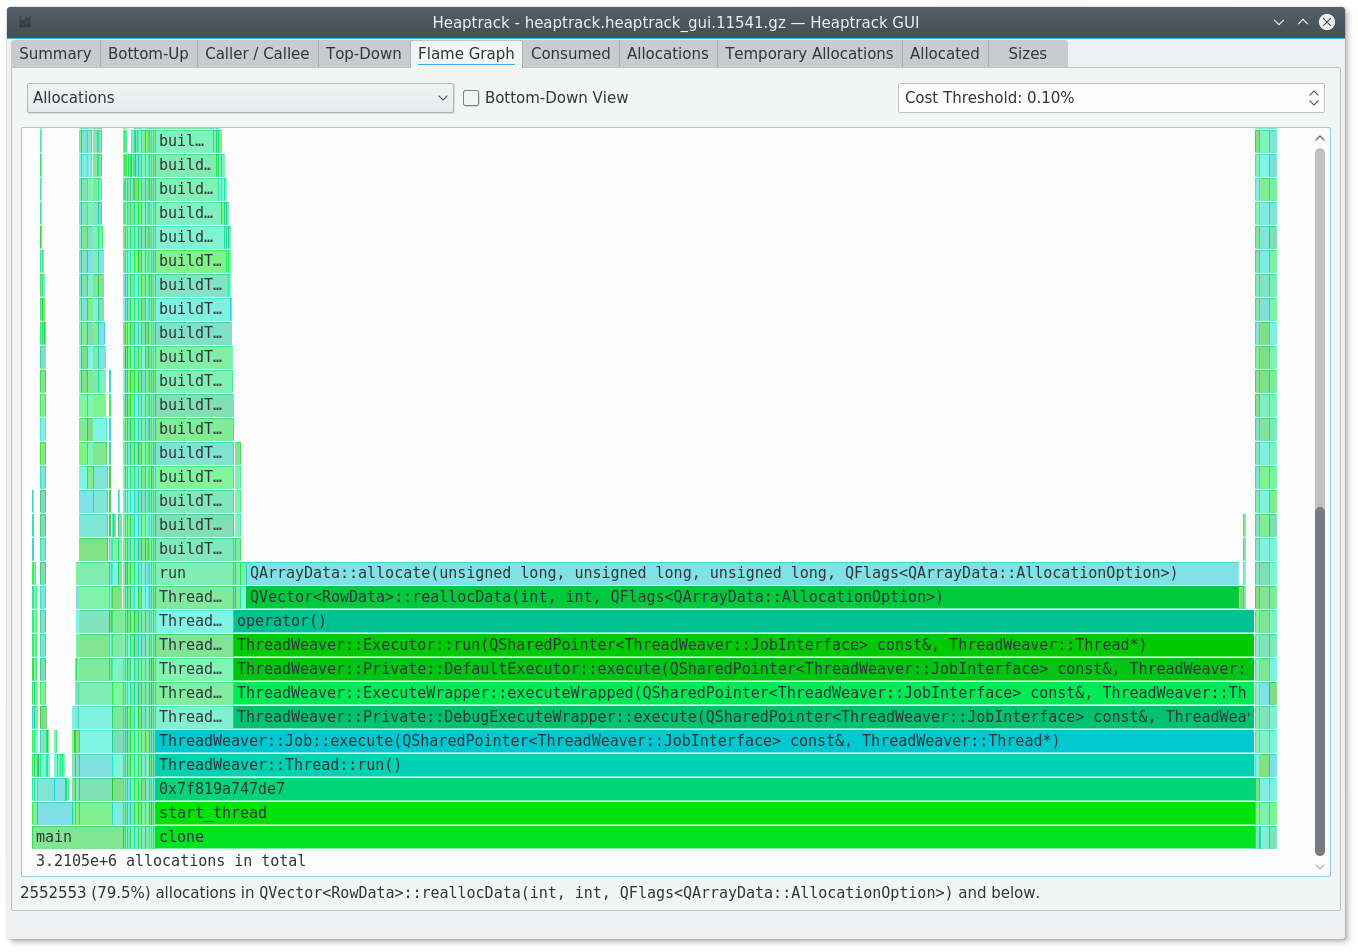
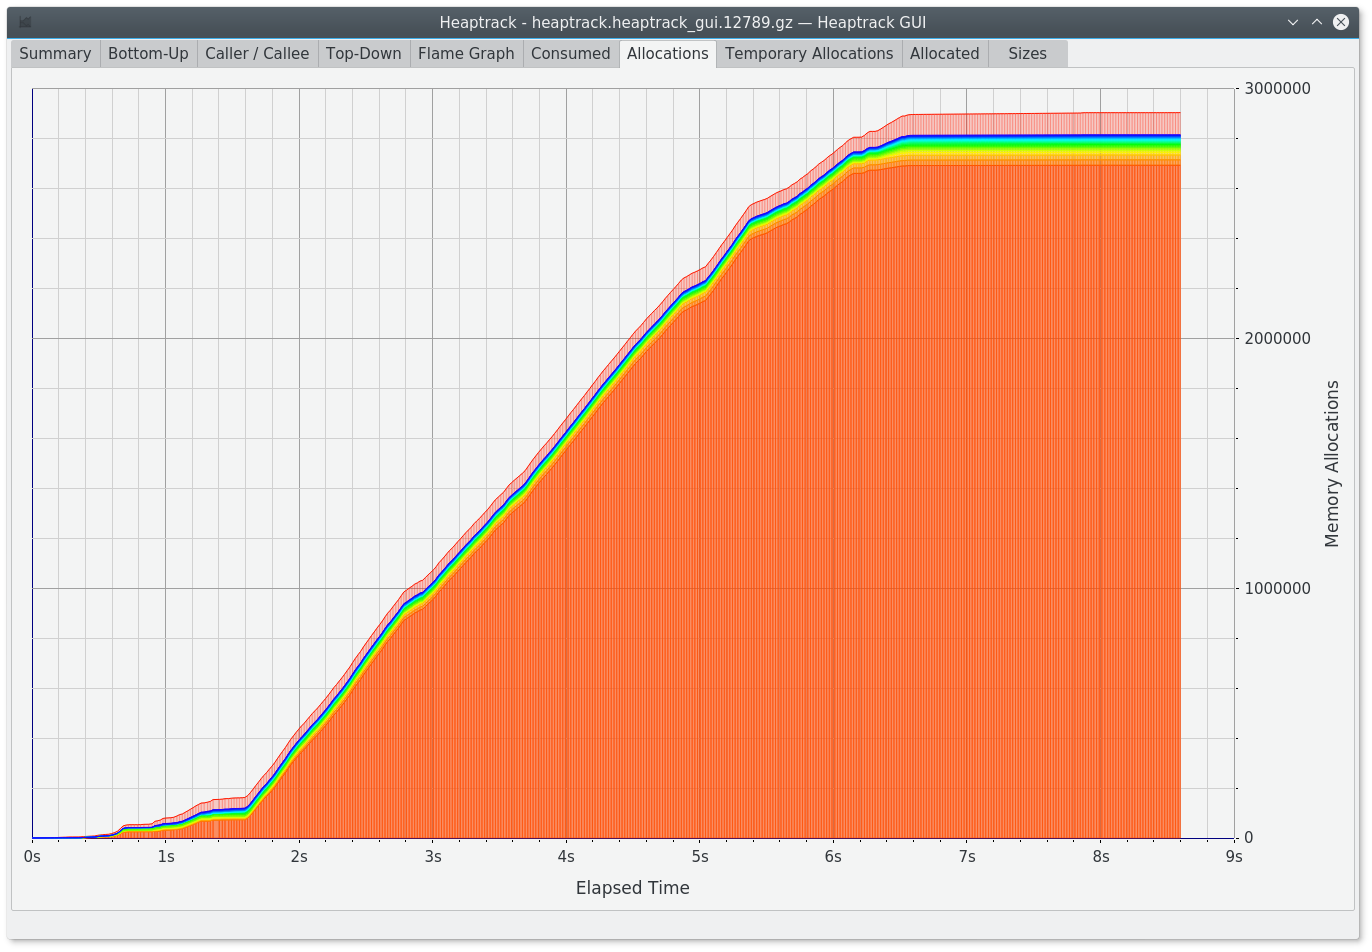
Heaptrack Screenshots